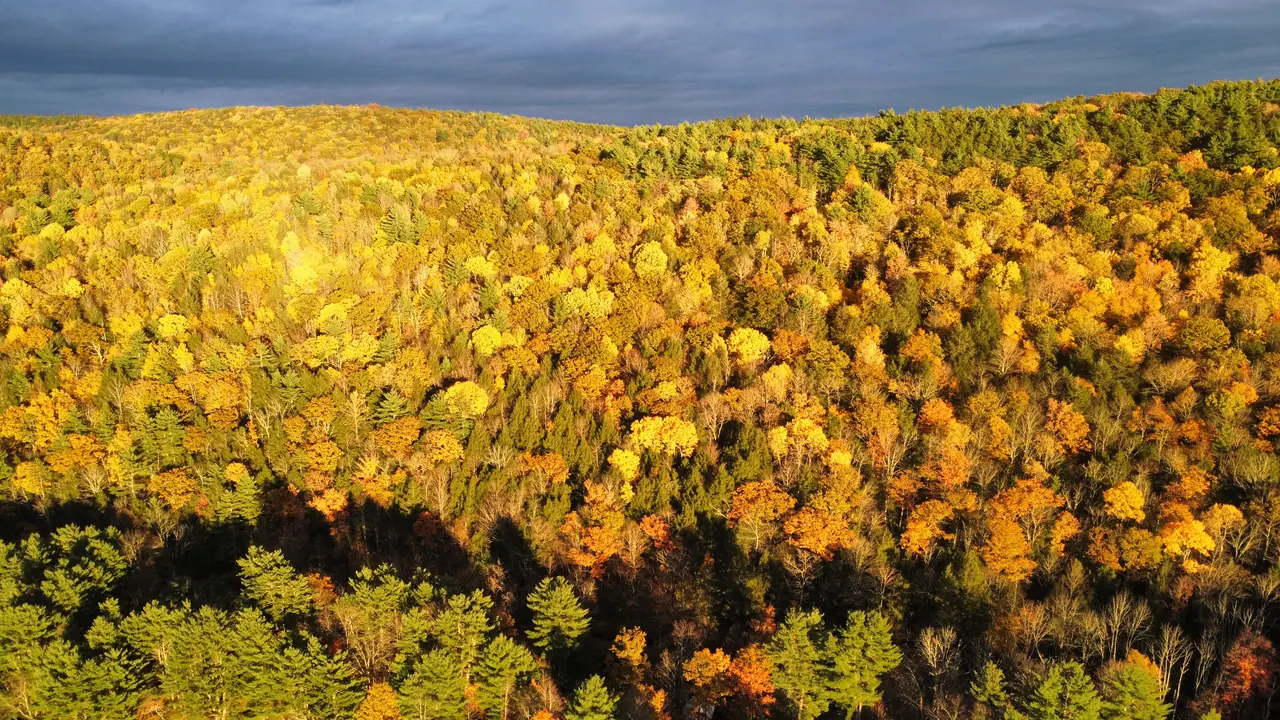
Biodiversity Survey · Mar 2025 – Oct 2026
Life at the Hollow
1,920 species across 30 riparian acres in Tioga County, NY — 750 of them new to the county record. The survey is a year old and still nowhere near done.
Latest
What's New
Start with species added to the Kingfisher Hollow list, then scan the latest photographic evidence—including return sightings that show what remains active now.
0 new species added to the Kingfisher Hollow list · from 3 recent observations
No brand-new species in this batch — but the count keeps climbing.
Recent evidence
More from the latest survey work
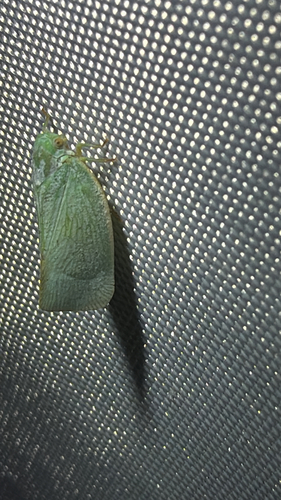
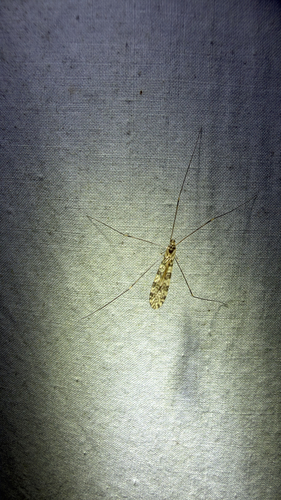
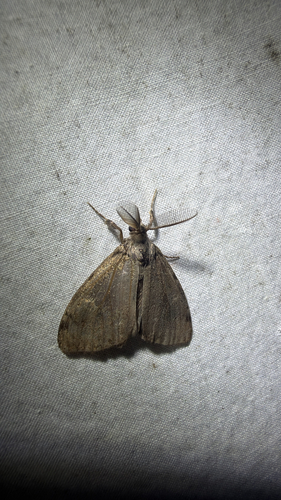
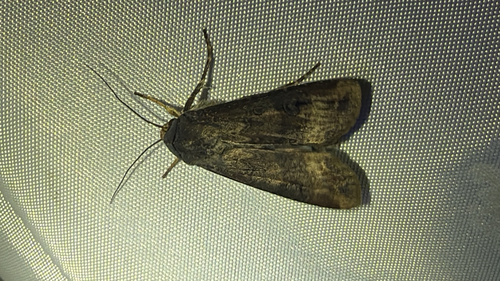
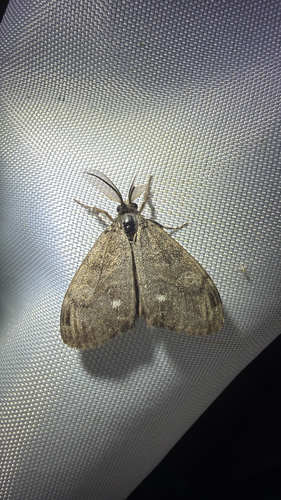
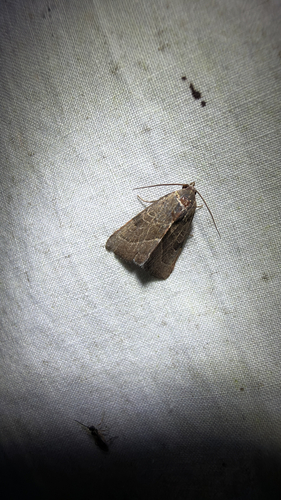
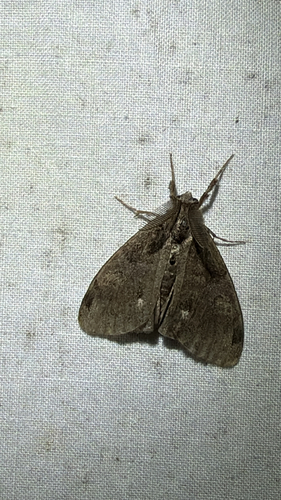
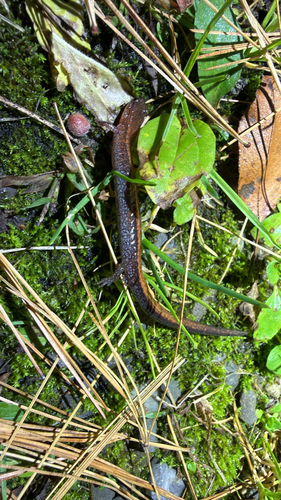
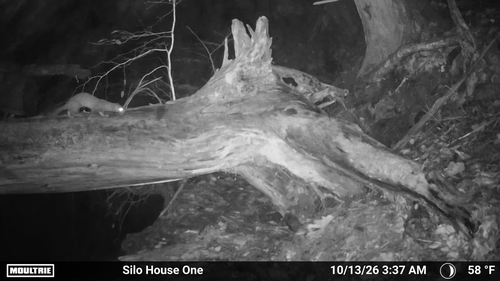
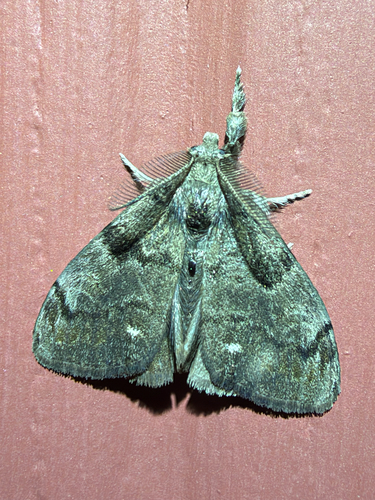
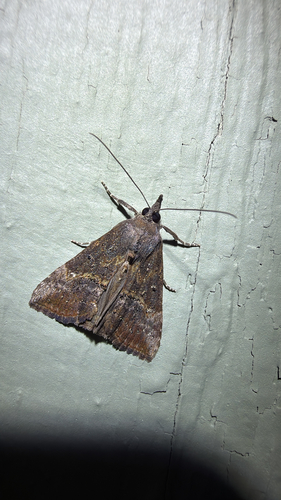
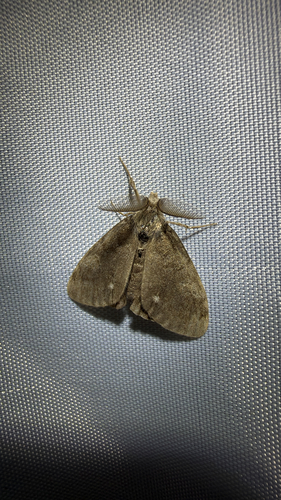
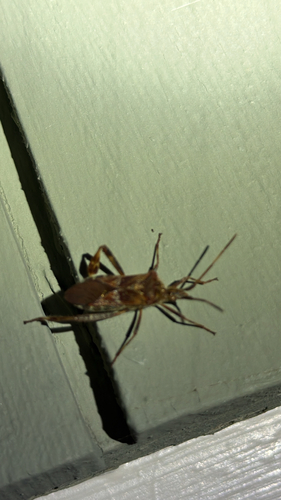
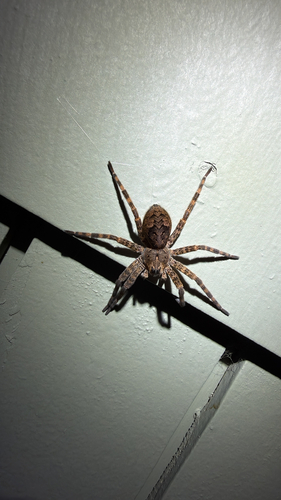
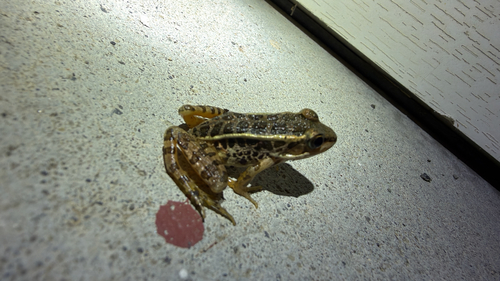
Recent research-grade photographs from iNaturalist—the visual record behind both new additions and return sightings.
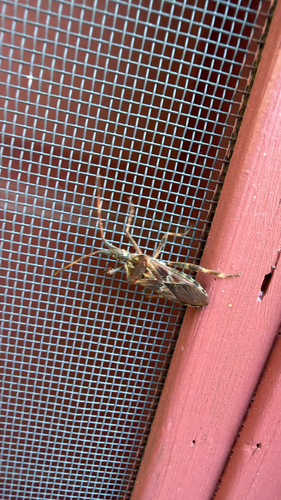
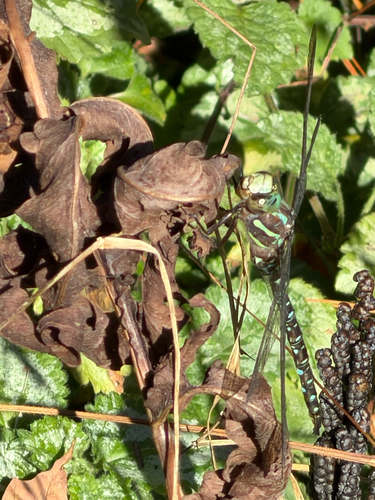
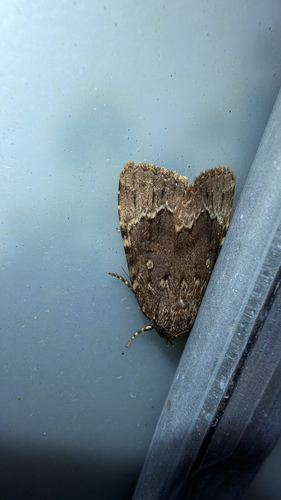
The Story So Far
A Growing Life List
1,920 steps, each the moment a species was recorded at Kingfisher Hollow for the first time. The curve hasn't levelled off.
Each step marks a species' first record at Kingfisher Hollow. New steps after 9,522 records show that the inventory is still actively growing.
The curve is still gaining species after 9,522 records. The latest rise again came from changing methods. Close fungal work on August 22-23 produced a sharp run of additions; creek and pond circuits added research-grade Black Saddlebags and provisional Fawn Darner and Familiar Bluet leads; night lighting added host-search leads from pondweed, oak, beech, peppergrass, and thistle moths. Several of the smallest moth identifications remain provisional, and mobile dragonflies do not prove local emergence. Strong records expand the ecological story; provisional records sharpen the next field check. No single method owns the remaining frontier.
Distinctiveness
What Stands Out — and Why
County-first records show where Kingfisher Hollow strengthens Tioga County’s public baseline. Statewide scarcity, repeat observations, habitat, and evidence quality then show which records may carry a stronger signal.
Evidence 1 · County contribution
First in the public county record
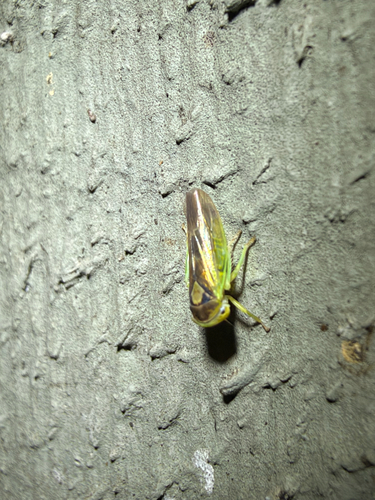
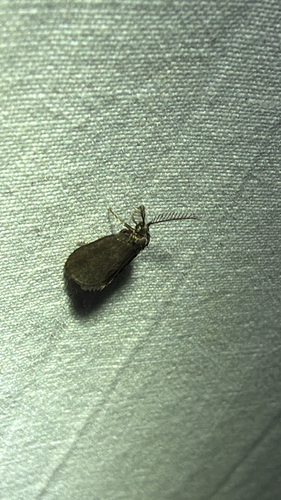
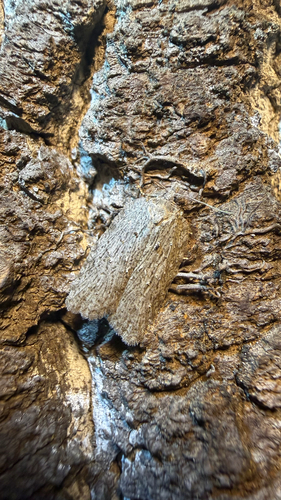
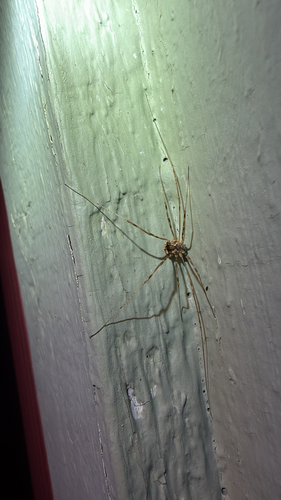
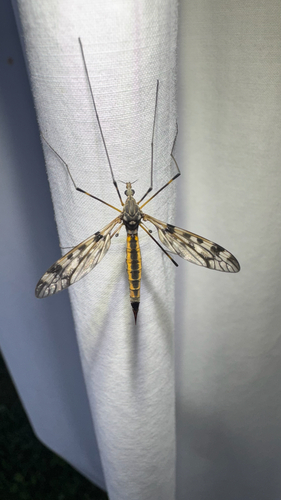
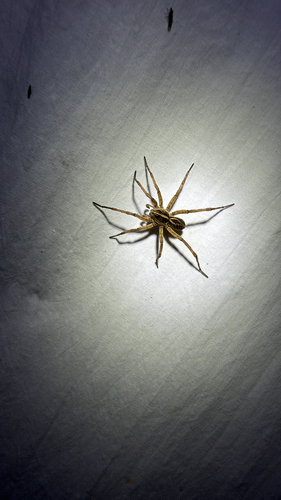
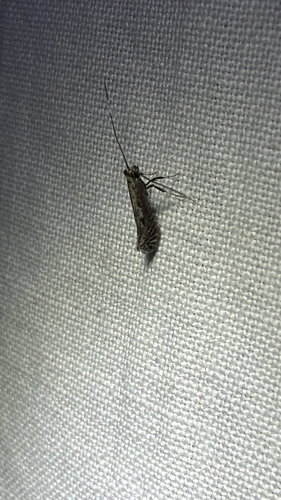
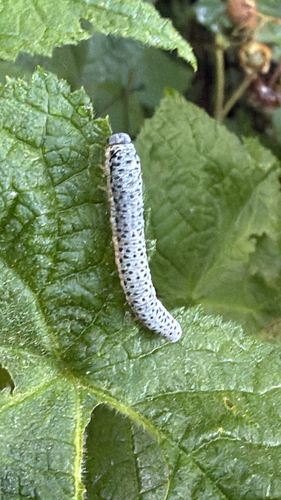
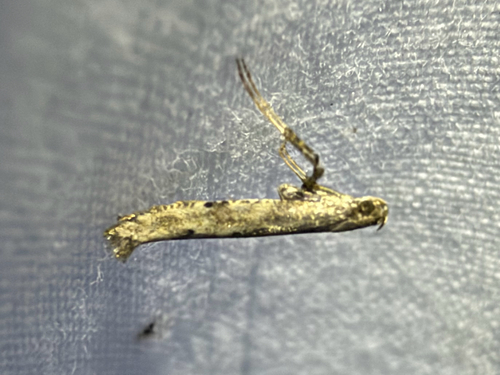
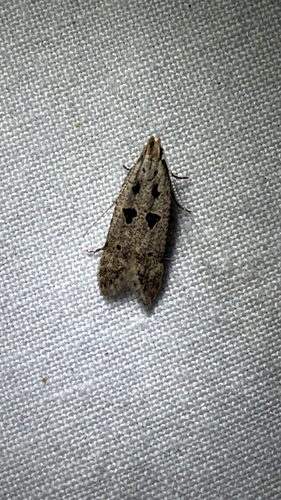
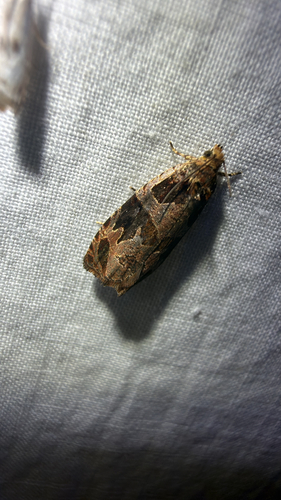
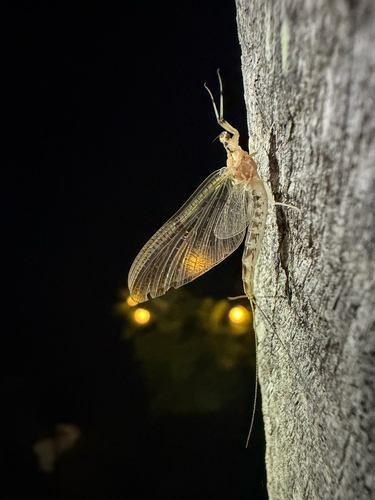
750 county-first iNaturalist records means Kingfisher Hollow has added 750 species to Tioga County's public, photo-vouchered baseline. That is not the same as proving each species was absent from the county before. Tioga is under-sampled, while nearby Tompkins County has heavy naturalist and entomology effort. The right reading is still powerful: KH is turning private regional likelihood into documented county evidence, especially for moths and plants tied to Michigan Creek's transition-zone habitats. The newest cluster is especially instructive: leafminers, leafrollers, small beetles, flies, barklice, and planthoppers dominate it, exactly the groups most likely to be missed where close photography and specialist attention are sparse.
Evidence 2 · Rarity test
Then test the signal
Statewide scarcity and repeated local presence separate records that merely fill a county data gap from patterns that deserve closer ecological or identification review.
Each dot is one species. X-axis: NY public-record scarcity (further left = fewer statewide records). Y-axis: frequency at Kingfisher Hollow. Terracotta: first iNaturalist record for Tioga County.
Upper-left is the territory to investigate: few public New York records, but repeated records here. Some dots may be genuinely notable; others are under-documented groups, hard IDs, or observer-bias artifacts. The expert move is to check evidence quality, host plant, habitat, and outside sources before turning a low iNaturalist count into a rarity claim.
Records that deserve a closer look
These have especially small New York iNaturalist footprints. They are review priorities, not automatic rarity claims.
Effort & Breadth
Activity & Taxa
Daily record totals and a taxonomic breakdown — how the effort is distributed and what it's actually finding.
The tall spikes are nights at the mothing lights; a well-run session can generate 50 to 100 observations before dawn. That effort reveals a real insect-heavy fauna, but it also exposes the survey's bias. Plants need seasonal ID passes, butterflies need sunny transects, mammals need cameras and acoustics, and herps need wet-night and stream methods. The site is rich, and the method mix still decides what becomes visible.
Phenology
When Things Appear
The 24 most-recorded species across the calendar year — each one's seasonal rhythm in a single row.
Each row is normalized to its own peak, so a species seen 5 times reads as vividly as one seen 500 times — rare species' patterns show up alongside common ones. Hover for raw counts.
Read across any row: one species' warm-up, peak, and fade. Read down any column: the community active in that month. The bright diagonal moving from spring to autumn is the year itself, written in species. Sparse months are both biology and effort: some taxa are truly seasonal, and some simply have not been searched for at the right time.
Credit Where Due
The Observers
The survey exists because people showed up and submitted what they found. Each bar is one person's contribution; hover to see how many species only they have found here.
Every record is attributed. Hover any bar to see how many observations a person submitted — and how many species only they have found here. Some of those species wouldn't be on the list without that one person.
Where
On the Land
Every GPS-tagged observation on the 30 acres. The clusters show where effort has been concentrated; the gaps show what's still unwalked.
The heaviest clusters follow the stream corridor and the mothing-light stations. The sparser areas aren't empty; they're under-walked or need different methods. Upland edge transects, wetland plant passes, creek rock surveys, and camera or acoustic stations would all move records into currently blank-looking parts of the map. iNaturalist automatically obscures coordinates for rare or sensitive species.